| This page was automatically copied from an earlier version. Please check if this information is still correct and remove the {{converted}} tag
|
| AmCAT Version
|
| This page describes a feature in AmCAT 3.4
|
| View other version: 3.3 - 3.4 - 3.5
|
Aggregation shows search results on an aggregated level (per medium, time interval, search term or in total) as a table or graph. You can either aggregate towards one (e.g. search results per month) or two variables (e.g. search results in each media outlet per month). It is comparable to a cross table.
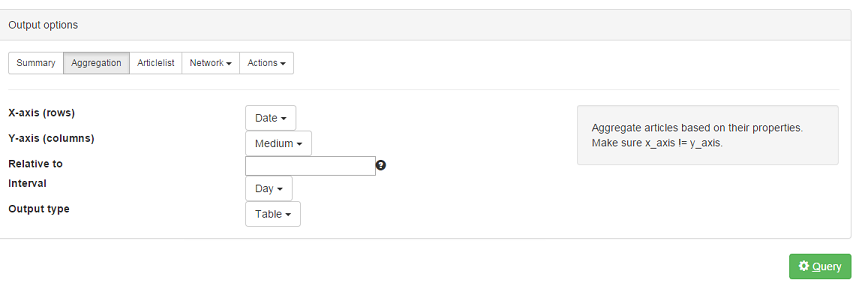
These are the different options for aggregation:
- X-axis and Y-axis Here you select the variables. If you only want to aggregate for one variable, select ‘total’ as the second axis.
- ('Relative to' will be added soon).
- Interval If you aggregate by time interval, select an interval that makes most sense.
- Output type Select whether you want the data displayed as a table, or as one of the four graph options (bar, scatter, line or heatmap). Although all graph options are possible for all aggregations, it is recommended that you use the visualization that best fits the data (e.g. line plots for aggregations over time, bar plots for results per medium, etc.). CSV downloads the aggregation as table in a .csv file.

 AmCAT
AmCAT